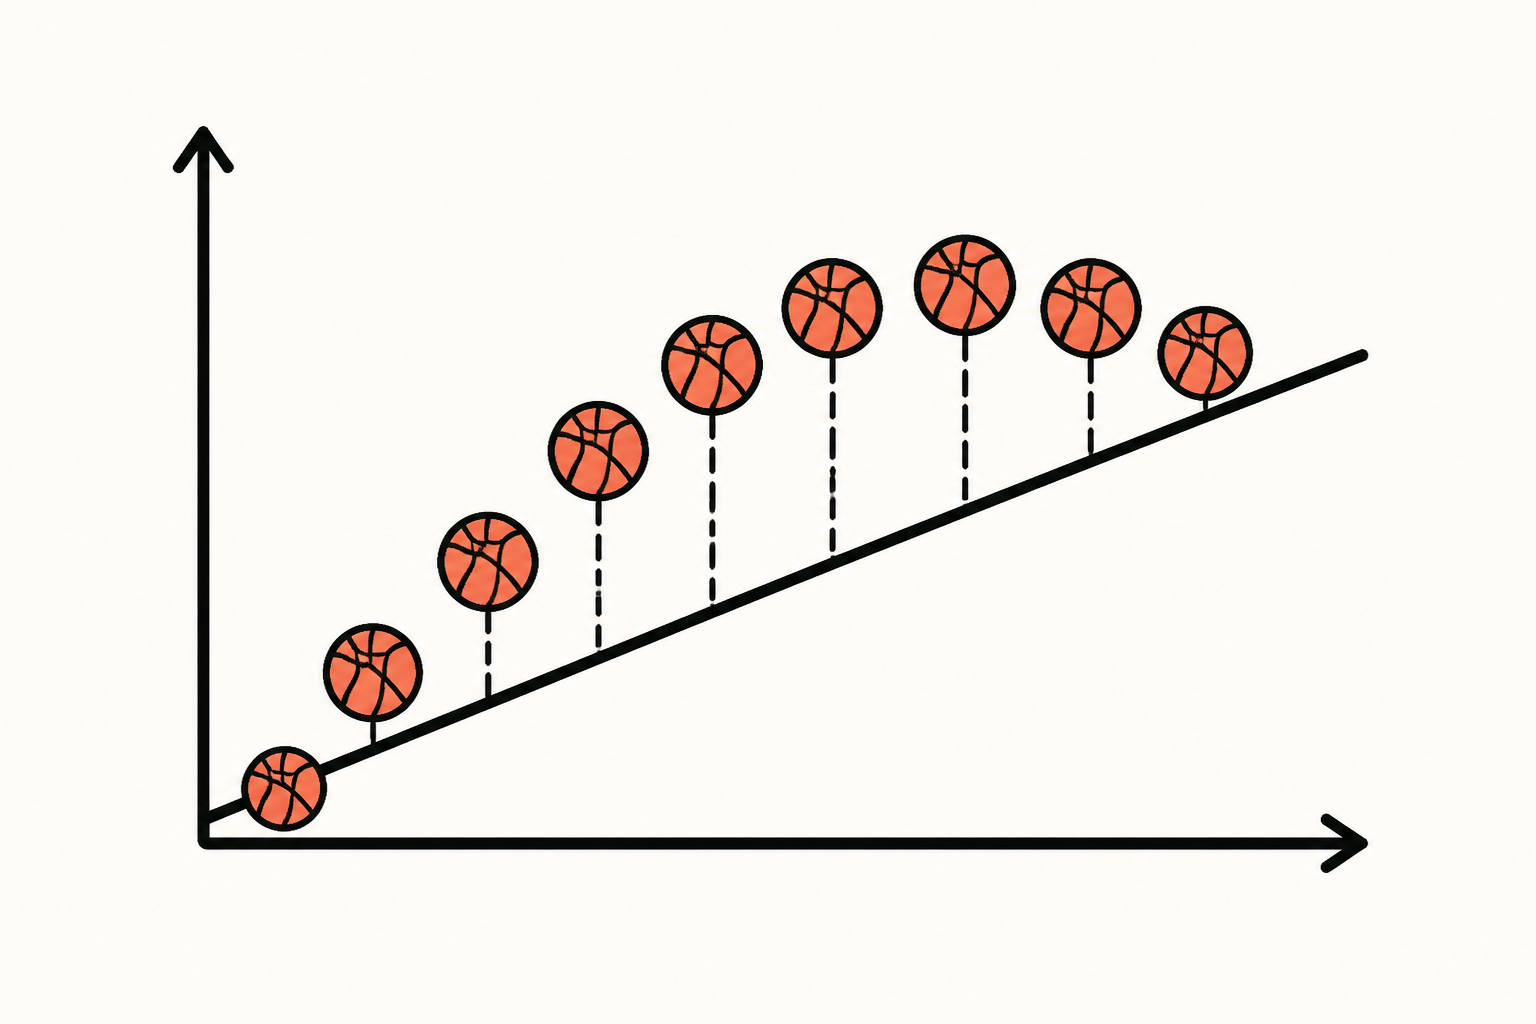
A team started cold, peaked midseason, then faded. The rookie fit a straight line to win% over the season and got confused.
0 / 2 graded
person
Rookie's submission
Model: win% ? game number · 82 games
ŷ = 0.45 + 0.001 × game
R² = 0.04
"...barely any relationship between form and time?"
1 · Why is the straight line failing here?
SLR only fits straight lines. A team that improves then declines traces a curve; the best straight line through it is nearly flat, hiding a real (non-linear) pattern.
2 · What's the right move?
When a scatter is clearly curved, plain SLR is the wrong tool — fit a curve (polynomial) or transform, then re-check the residuals.
show_chart
Graded — not every link is a line.
A near-zero R² on obviously curved data is the tell: the pattern is real, but it isn't straight.