Practice · Case File
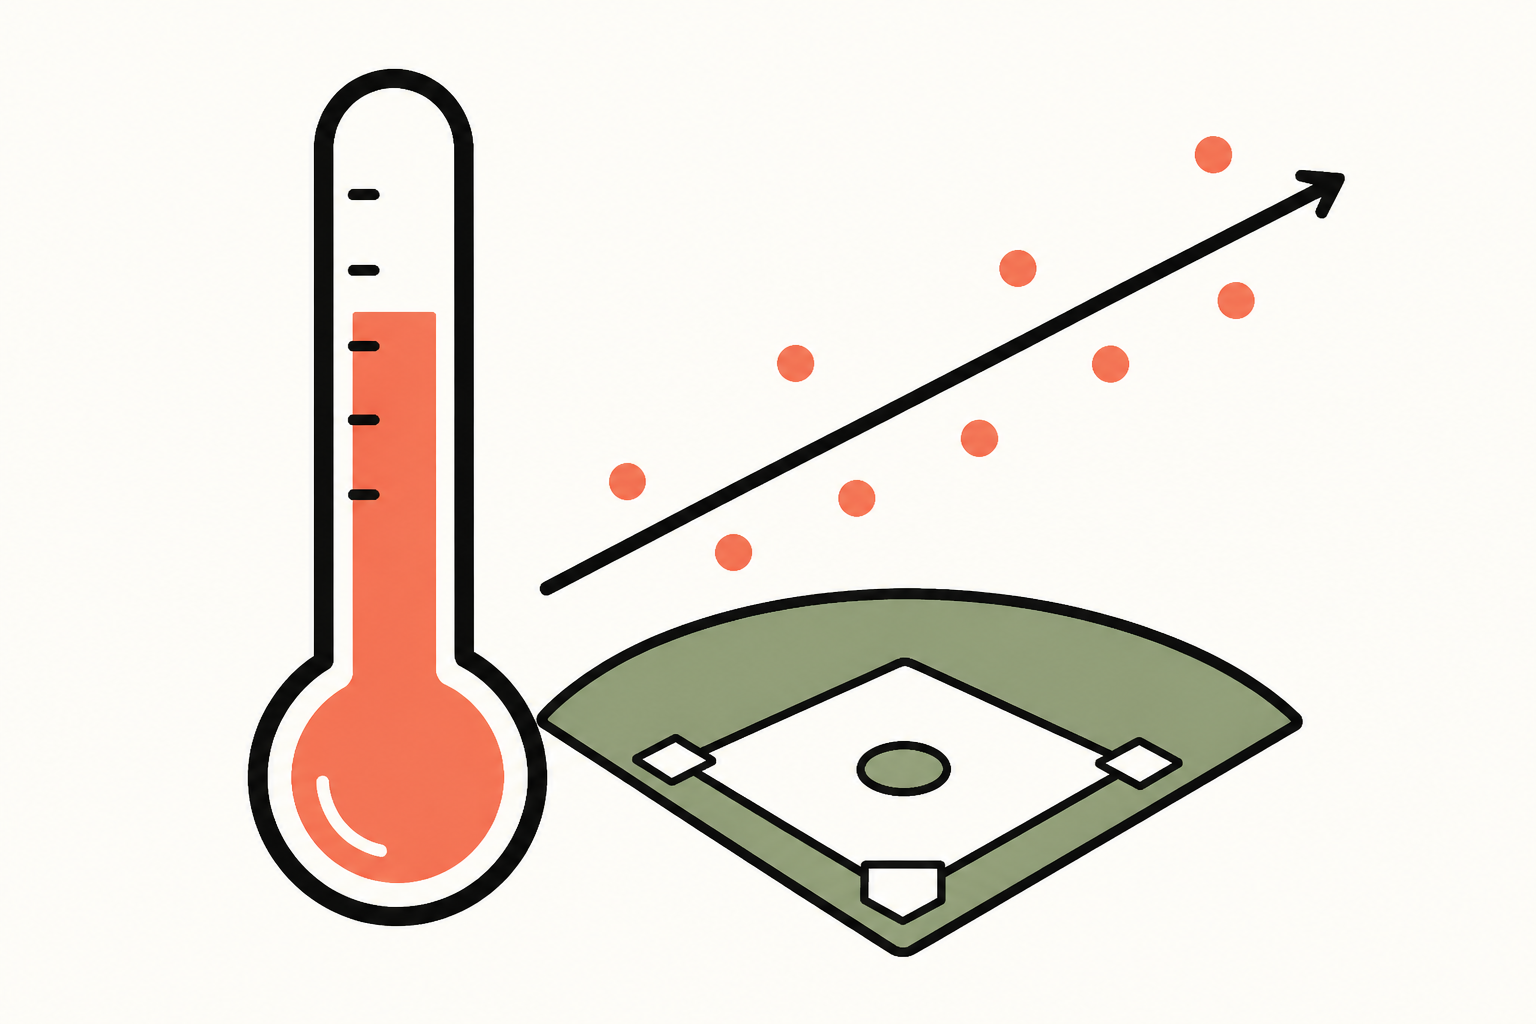
The Dodgers & the heat
The Dodgers' analyst has a hunch: the team scores more in hotter weather. You've got 8 home games. No steps are laid out for you — decide the approach yourself.
The Dodgers' analyst has a hunch: the team scores more in hotter weather. You've got 8 home games. No steps are laid out for you — decide the approach yourself.
Before any maths: is this even a regression job, and what plays the role of X and Y?
| Game | Avg temp (°F) | Runs scored |
|---|---|---|
| 1 | 72 | 3 |
| 2 | 78 | 5 |
| 3 | 85 | 6 |
| 4 | 68 | 2 |
| 5 | 91 | 8 |
| 6 | 80 | 5 |
| 7 | 88 | 7 |
| 8 | 95 | 8 |
You decided: SLR, with Y = runs and X = temperature. Now choose each move yourself — no checklist.

We've done the tedious sums (you drilled those already). Apply the formulas and check yourself.

Fitted line: ŷ = −13.66 + 0.233 × temp. Each +1°F is worth about a quarter of a run.
The stats are only useful if they answer the real question. Two calls to make.

A 10°F warmer season is worth roughly 2.3 extra runs per game, on average.
You framed it, planned it, crunched it, and made the call — that's SLR as a problem-solving tool, not a recipe.