Low Stakes Stats · Chapter 2
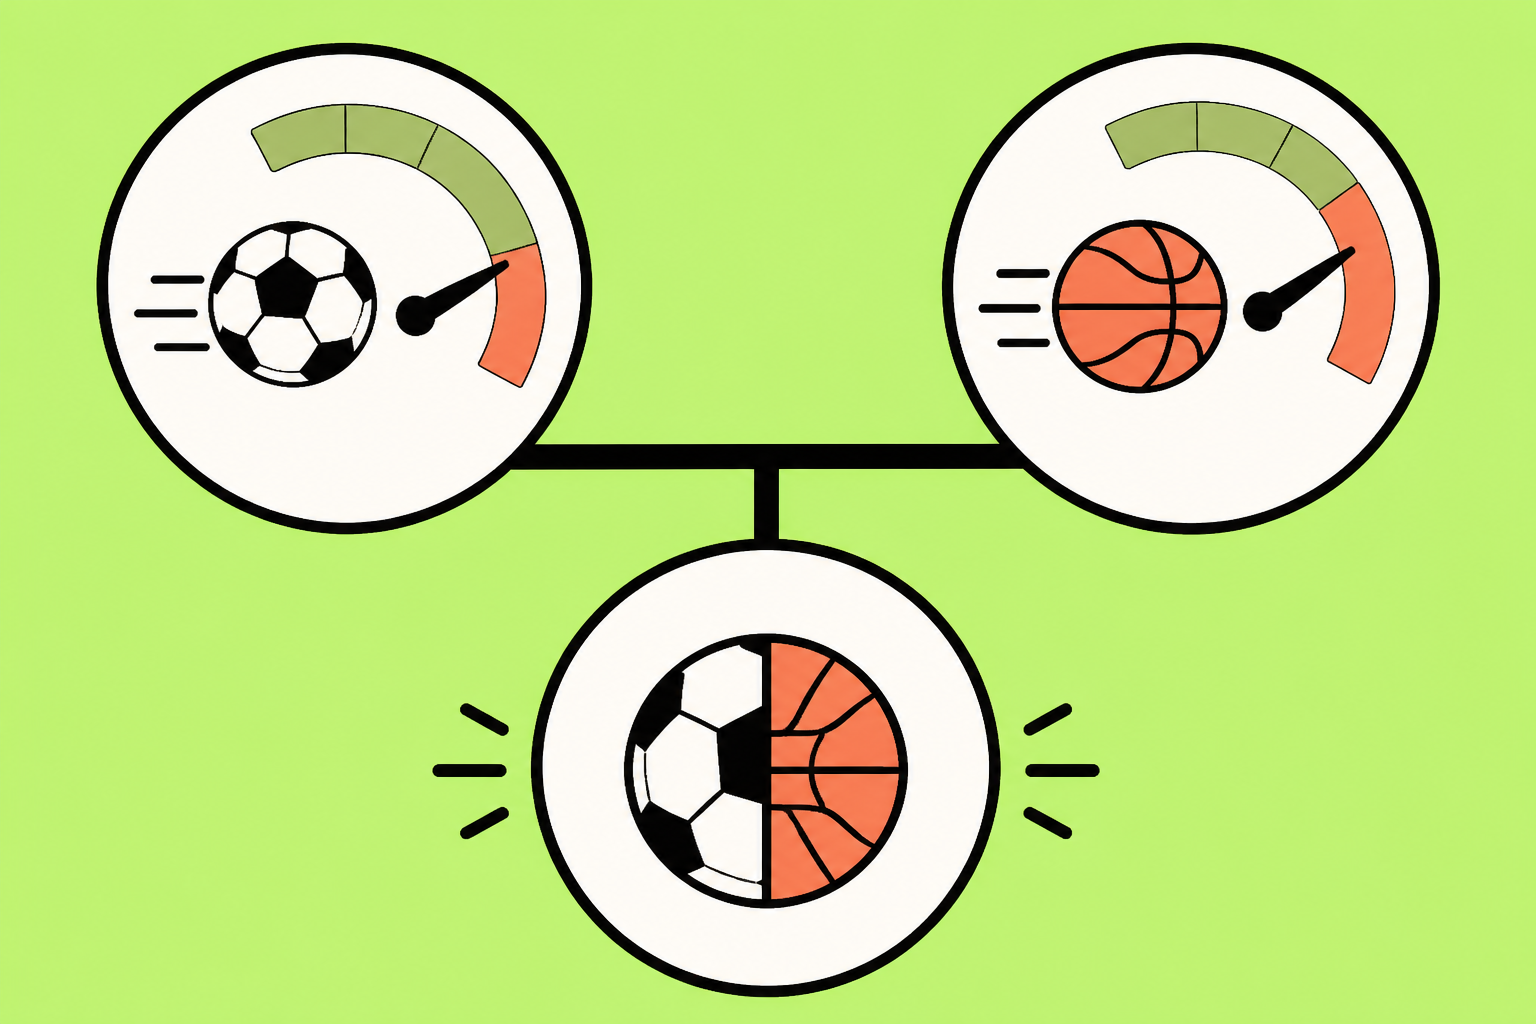
Two predictors
are better than one
Runs don't just come from home runs — walks put runners on base too. Multiple linear regression lets you use several predictors at once. Same idea as Chapter 1, one step up. First, the short primer.